Using ArcGIS Viewer & Story Maps for enhanced decision-making
Who is ORI?
The Oceanographic Research Institute (ORI) is a division of the South African Association for Marine Biological Research, a non-profit company that was formed in 1951 to undertake marine and coastal research in South Africa and the West Indian Ocean Region. ORI offers a range of marine science services: scientific investigation, management advice, training and capacity building, and consulting. Their scientific areas of expertise include coastal zone management. Given the complex nature of the coastal environment and the pressures it faces, management of this zone is challenging. ORI provides expert assistance and research-based advice to the KwaZulu-Natal Department of Economic Development, Tourism and Environmental Affairs (KZN EDTEA).
The Project
As a result of working with the KZN EDTEA, the need for an information sharing portal was identified. The aim of which was to store data and information, ensure knowledge transfer and display spatial data in a user-friendly, visually appealing format that would improve managers’ understanding and decision making capacity. The result is CoastKZN (www.coastkzn.co.za); an interactive website that targets all coastal stakeholders, providing coastal and estuarine data and information to decision makers and the general public alike.
The Challenge
The key challenges related to data visualisation were i) how to simplify spatial topics to increase users’ understanding, and ii) providing an online interactive map that offered simplified GIS functionality and which could inform locational decision making.
The Solution
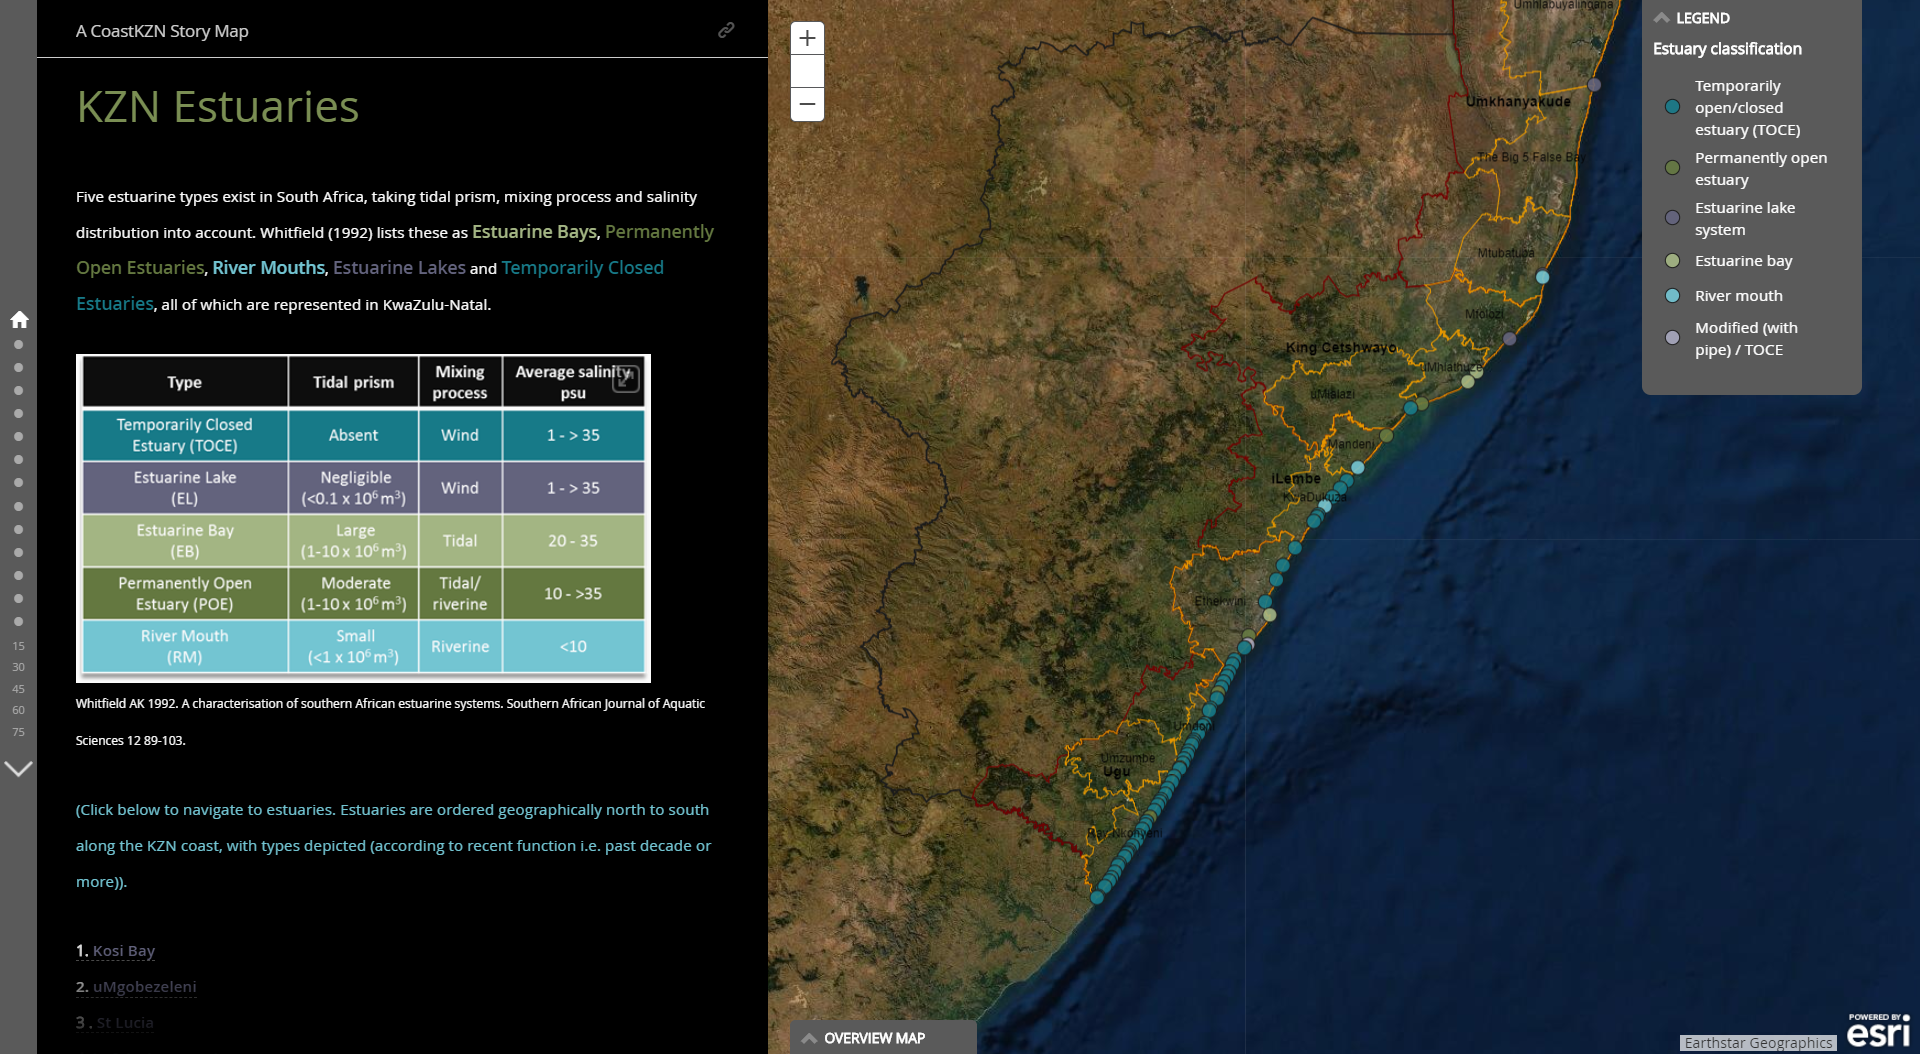
The data visualisation challenge was easily addressed using ArcGIS Story Maps. This allowed for the presentation of information and supporting spatial information that was easy to guide the user through. The result being increased understanding of the topic. ORI has used these for presenting information on “know your estuary”, defining the coastal zone and even testing a crowdsourced Story Map for tracking public contributions to an issue. This latter application was a great success.
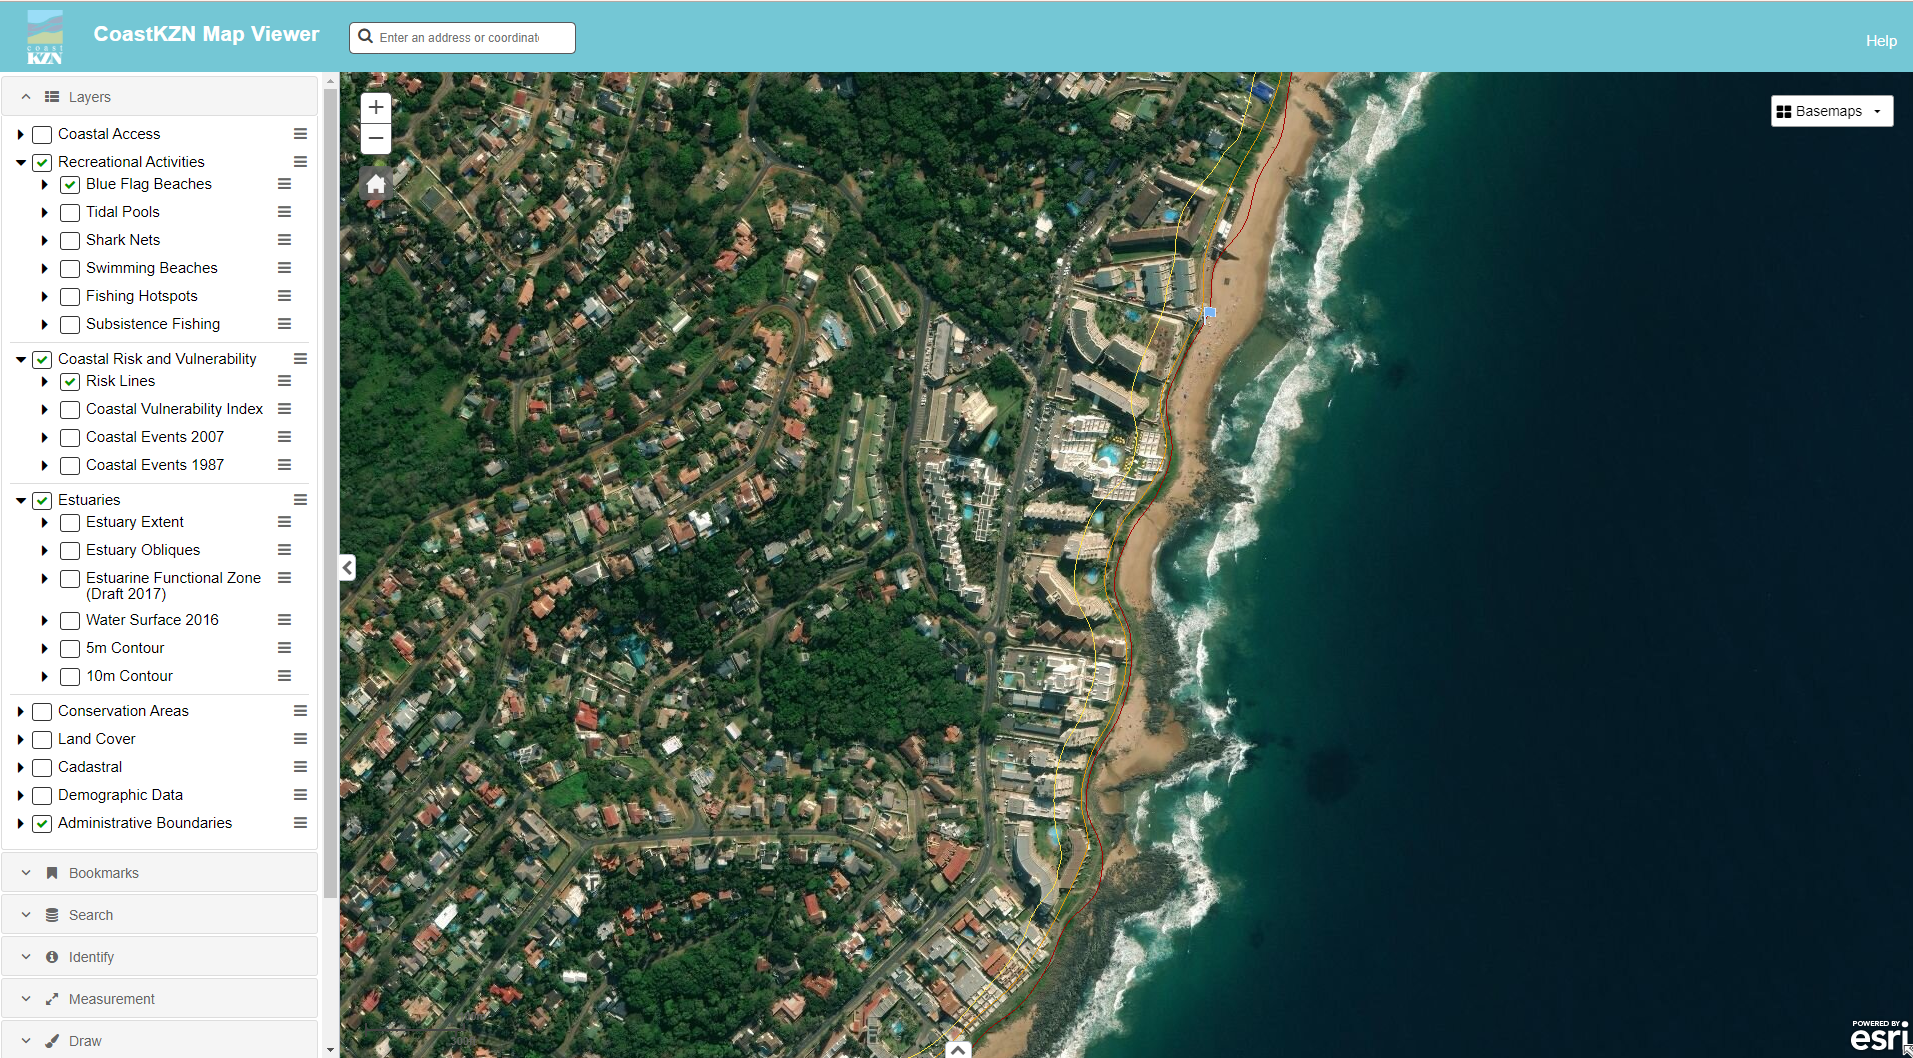
The need for interactive mapping was easily addressed by using the ArcGIS portal and the online viewer. This allowed us to display a wide range of spatial layers on topics relevant to coastal management. The Esri viewer provides various base-maps which simplify data storage and presentation, and has ultimately informed coastal management decision making in KwaZulu-Natal.
Conclusion
The use of Esri products helped us to develop this project to its full potential. It is now being successfully used by government for decision making.
The Challenge
– Create an information sharing portal
– Create an online interactive map with simplified GIS functionality
– Ensure knowledge transfer
The Solution
– ArcGIS Viewer
– ArcGIS Story Maps
The Benefits
– Ability to display a wide range of spatial layers
– Simplified data storage and presentation
– Enhanced decision-making capability